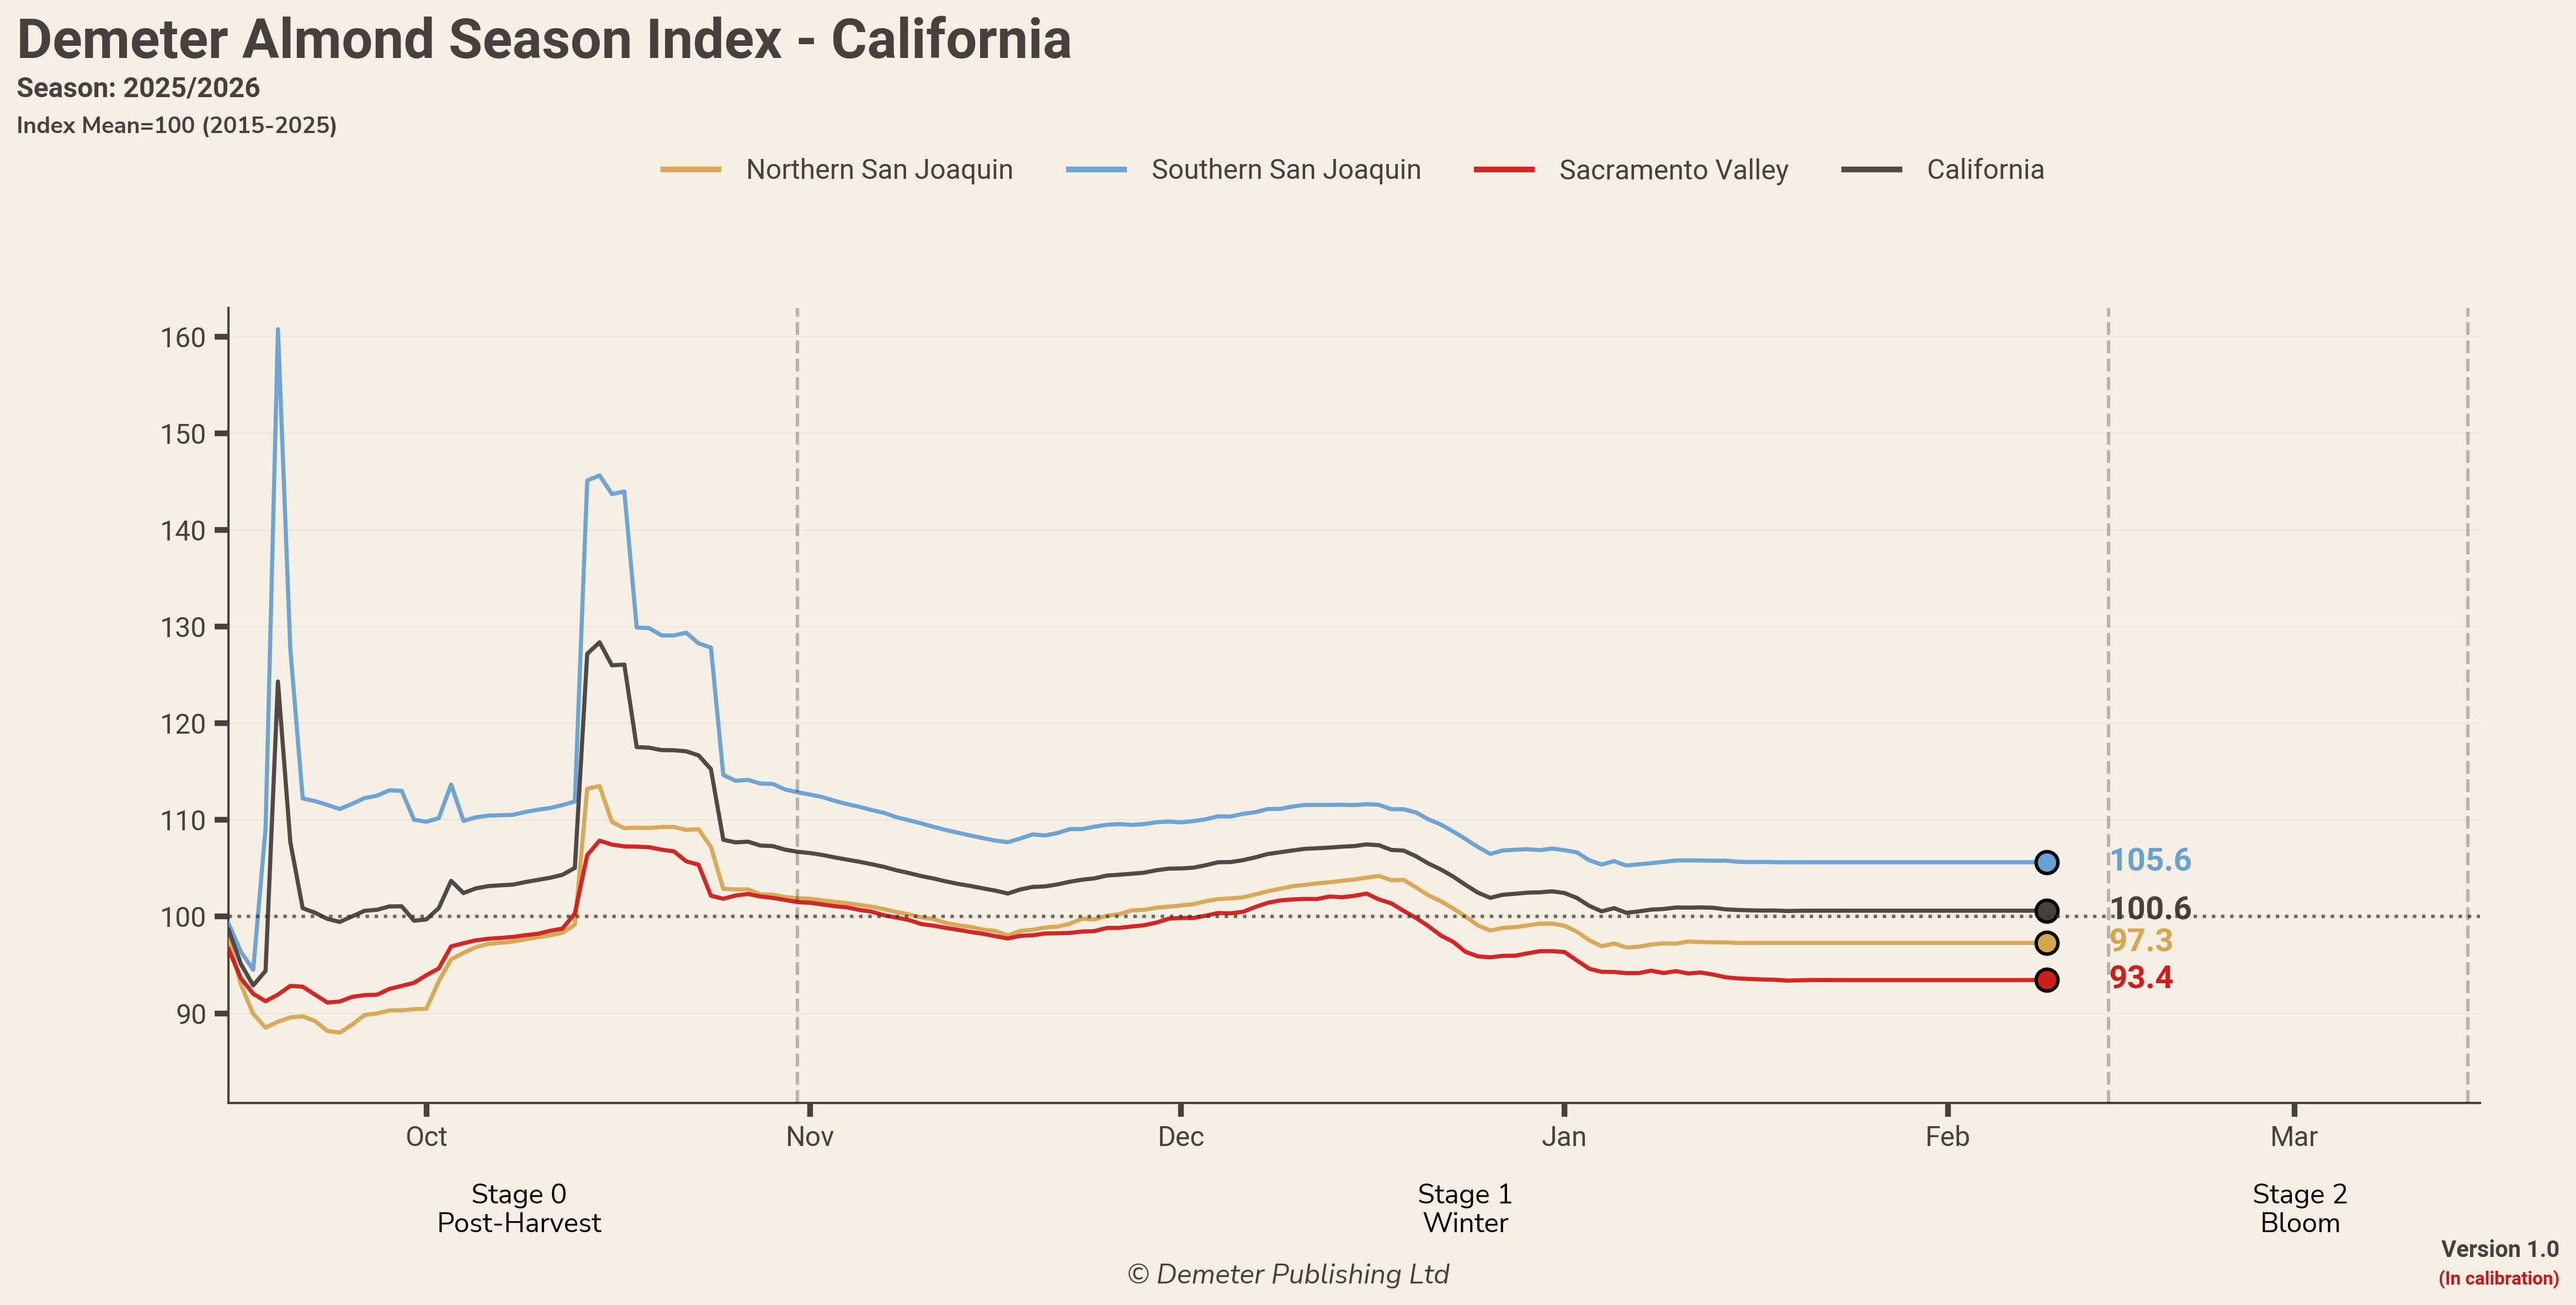
Almond Season Index
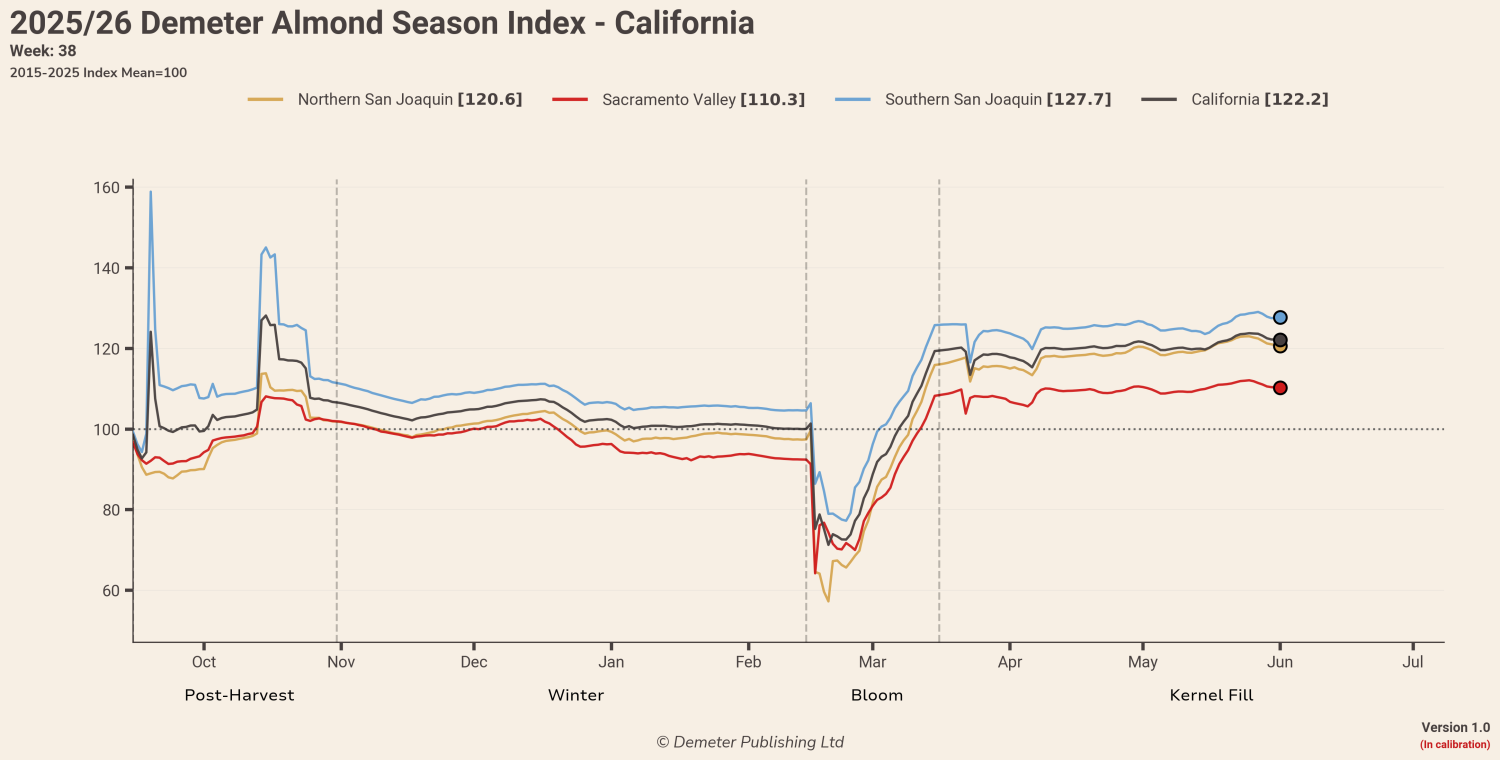
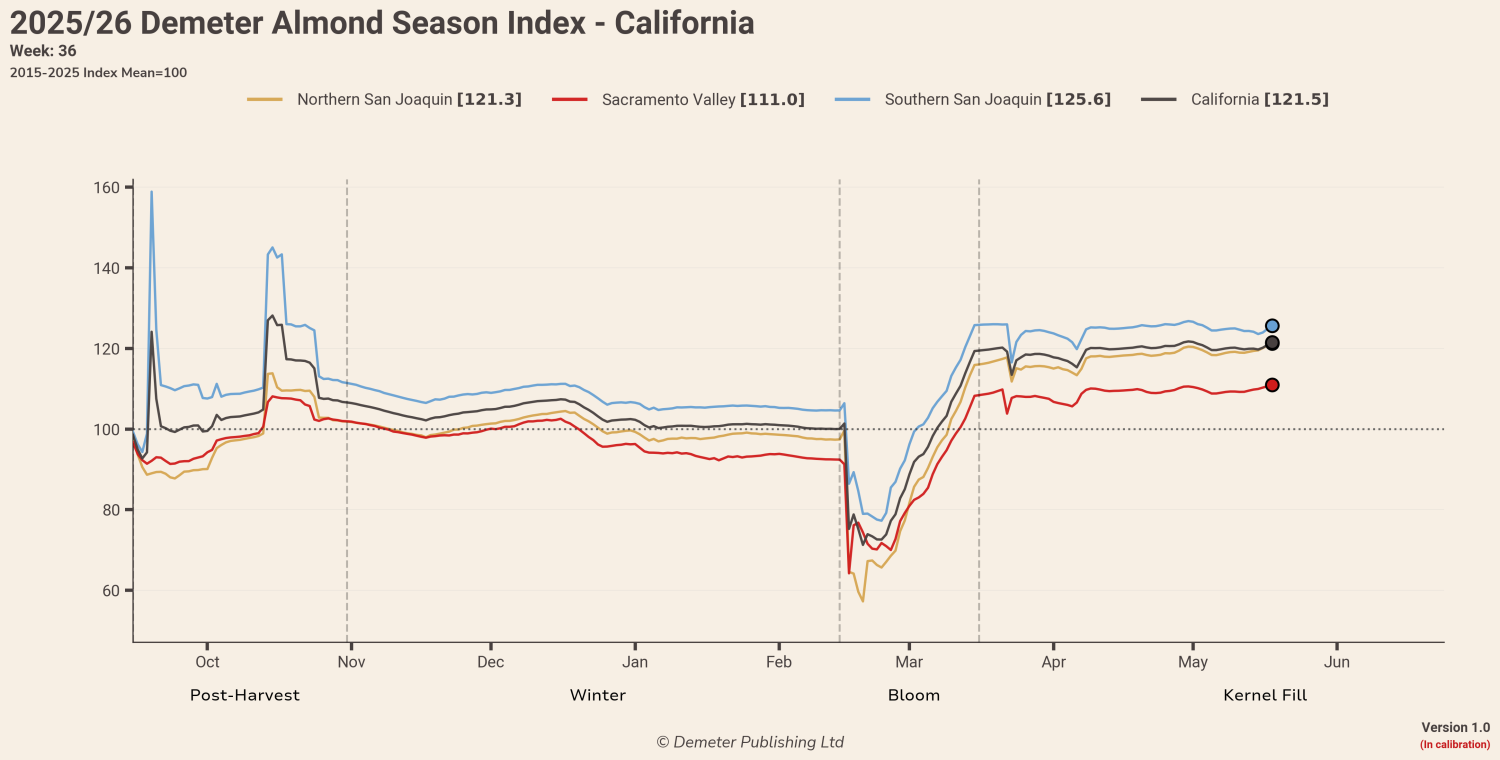
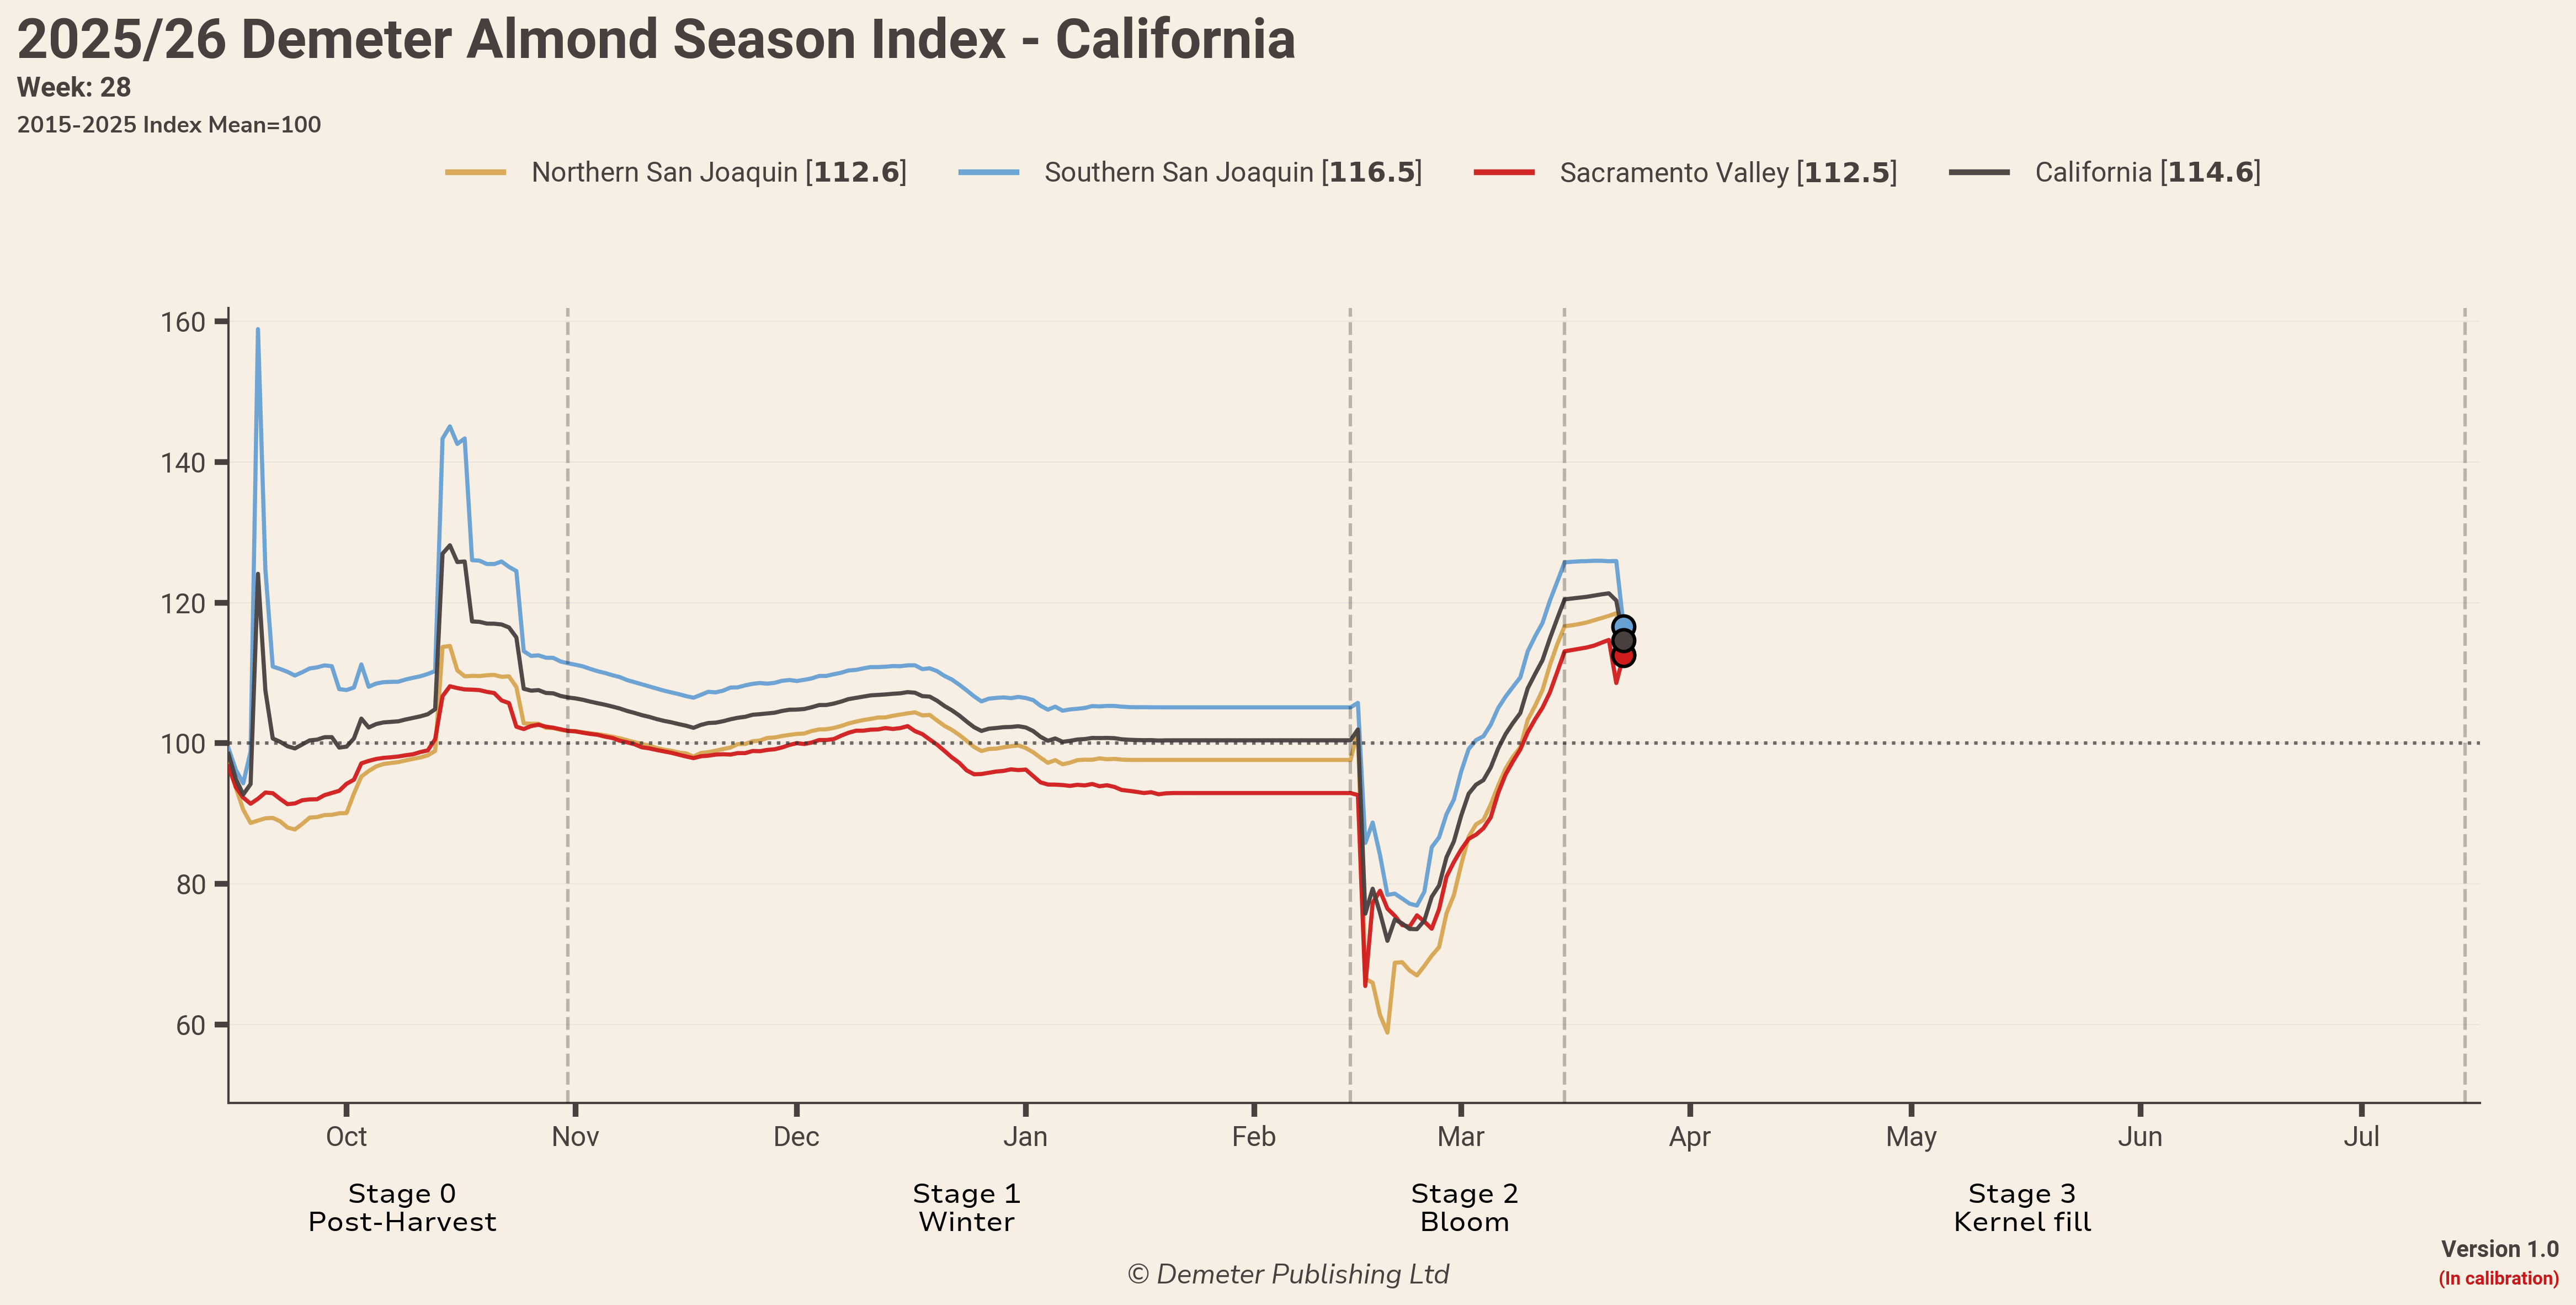
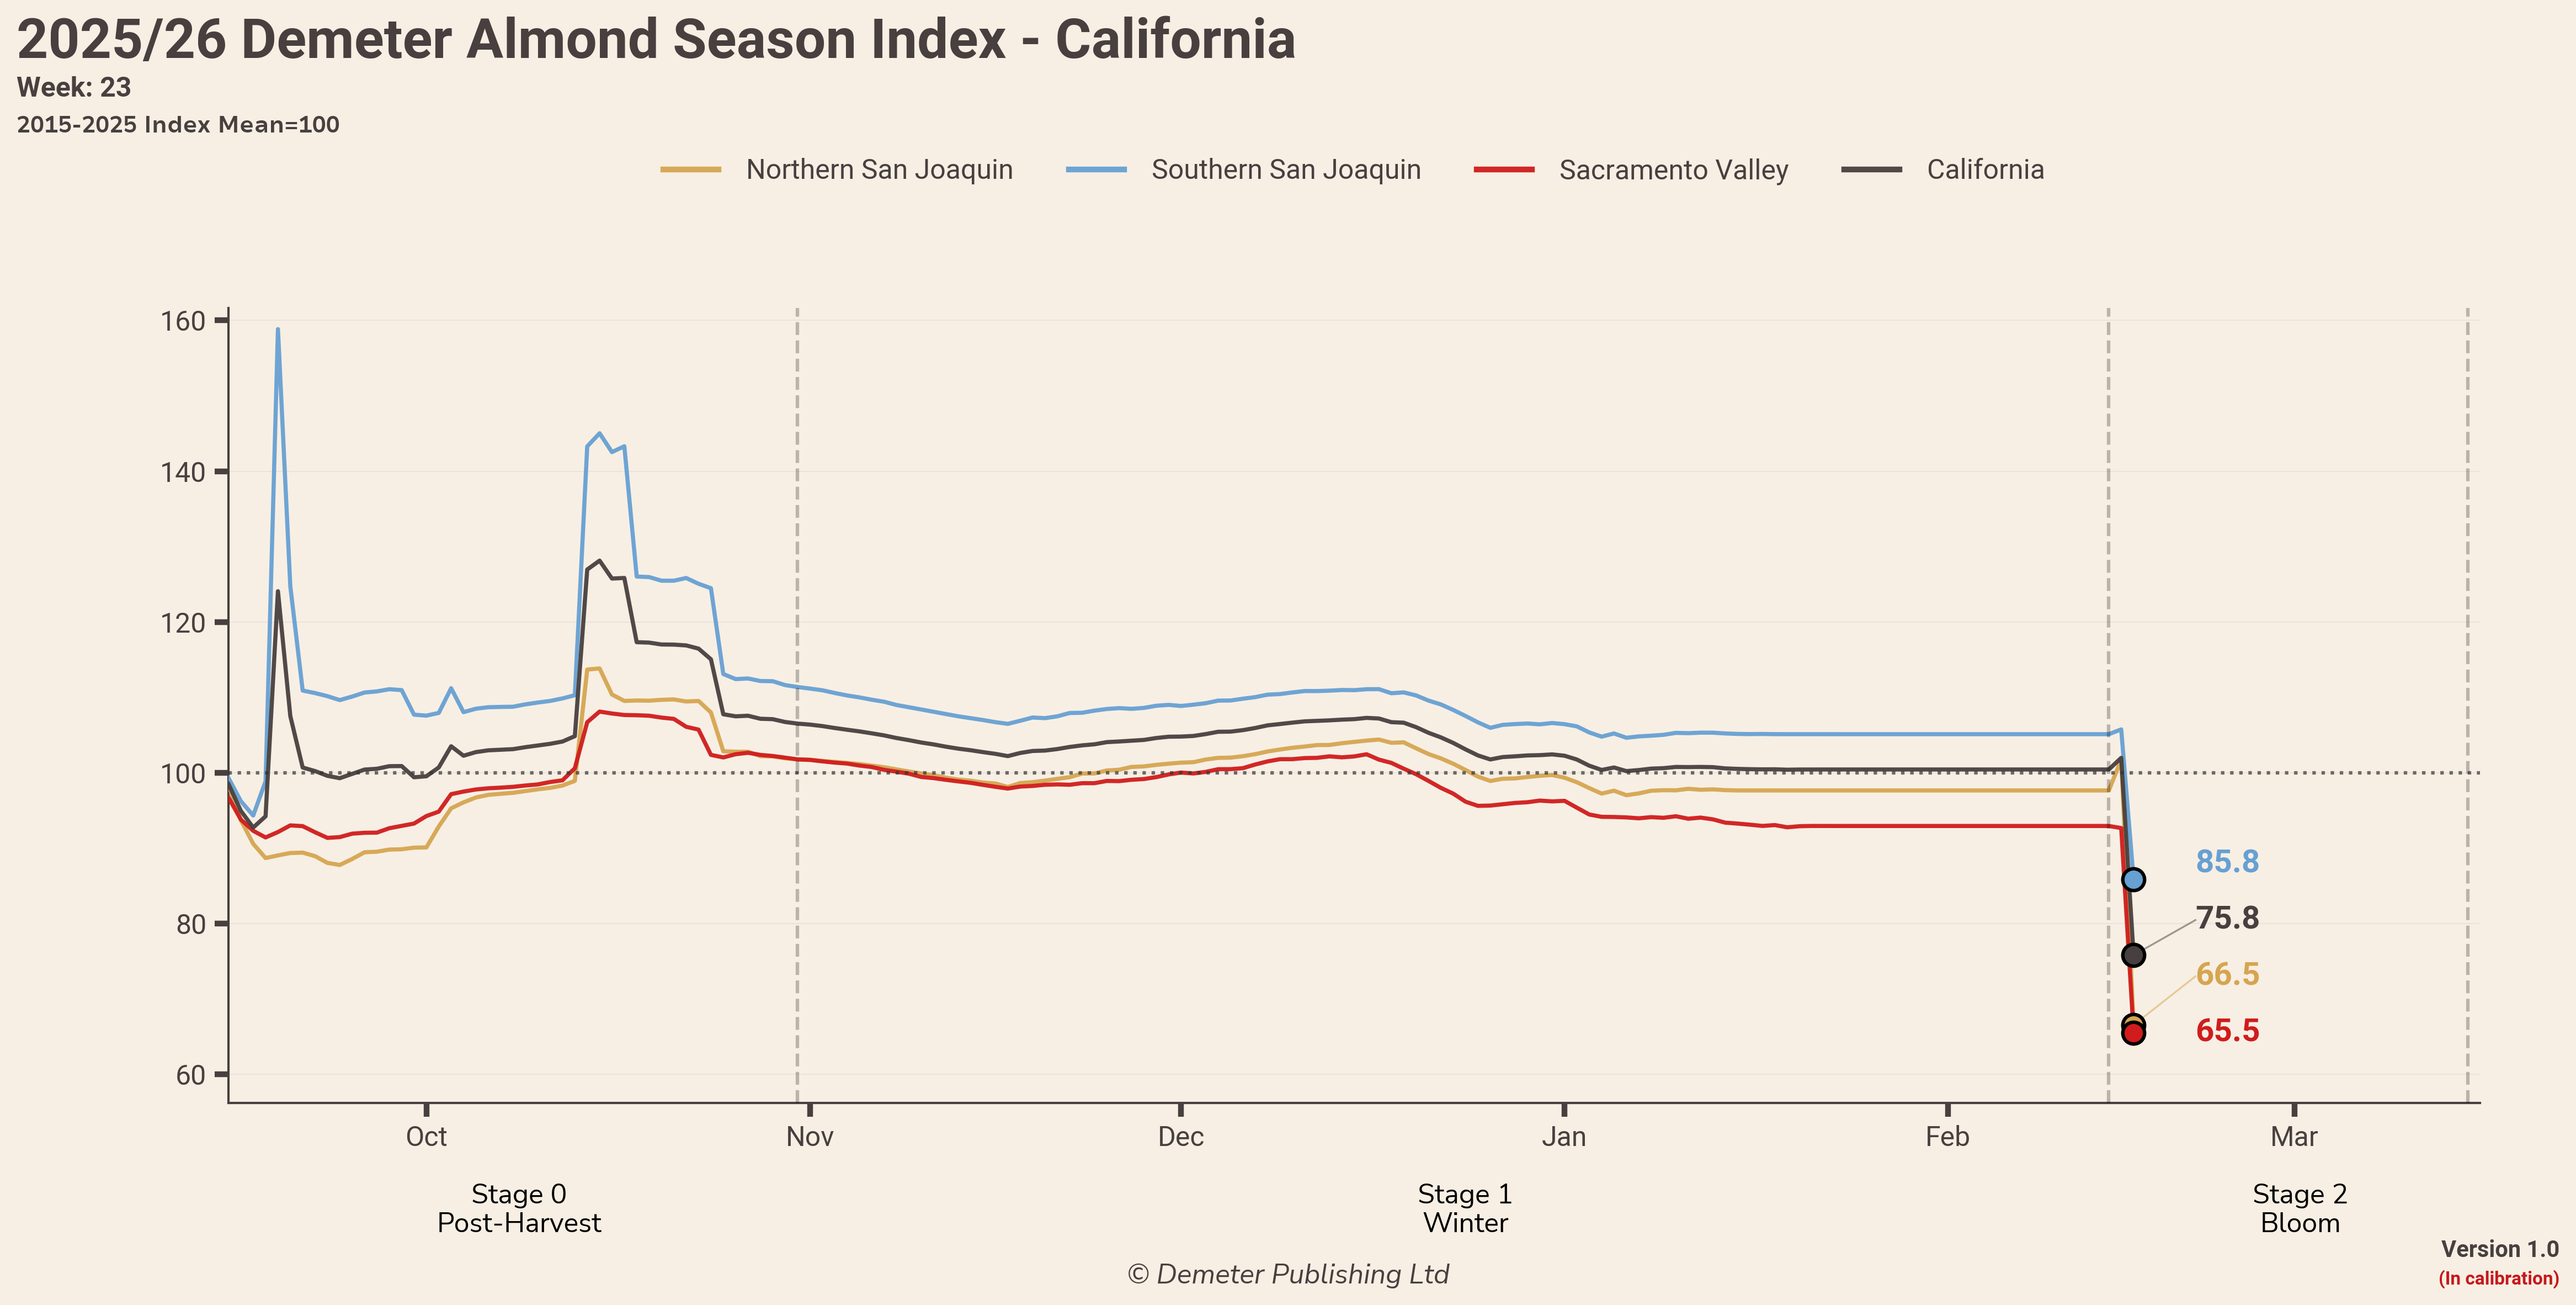
Demeter Almond Season Index Update - Week 38
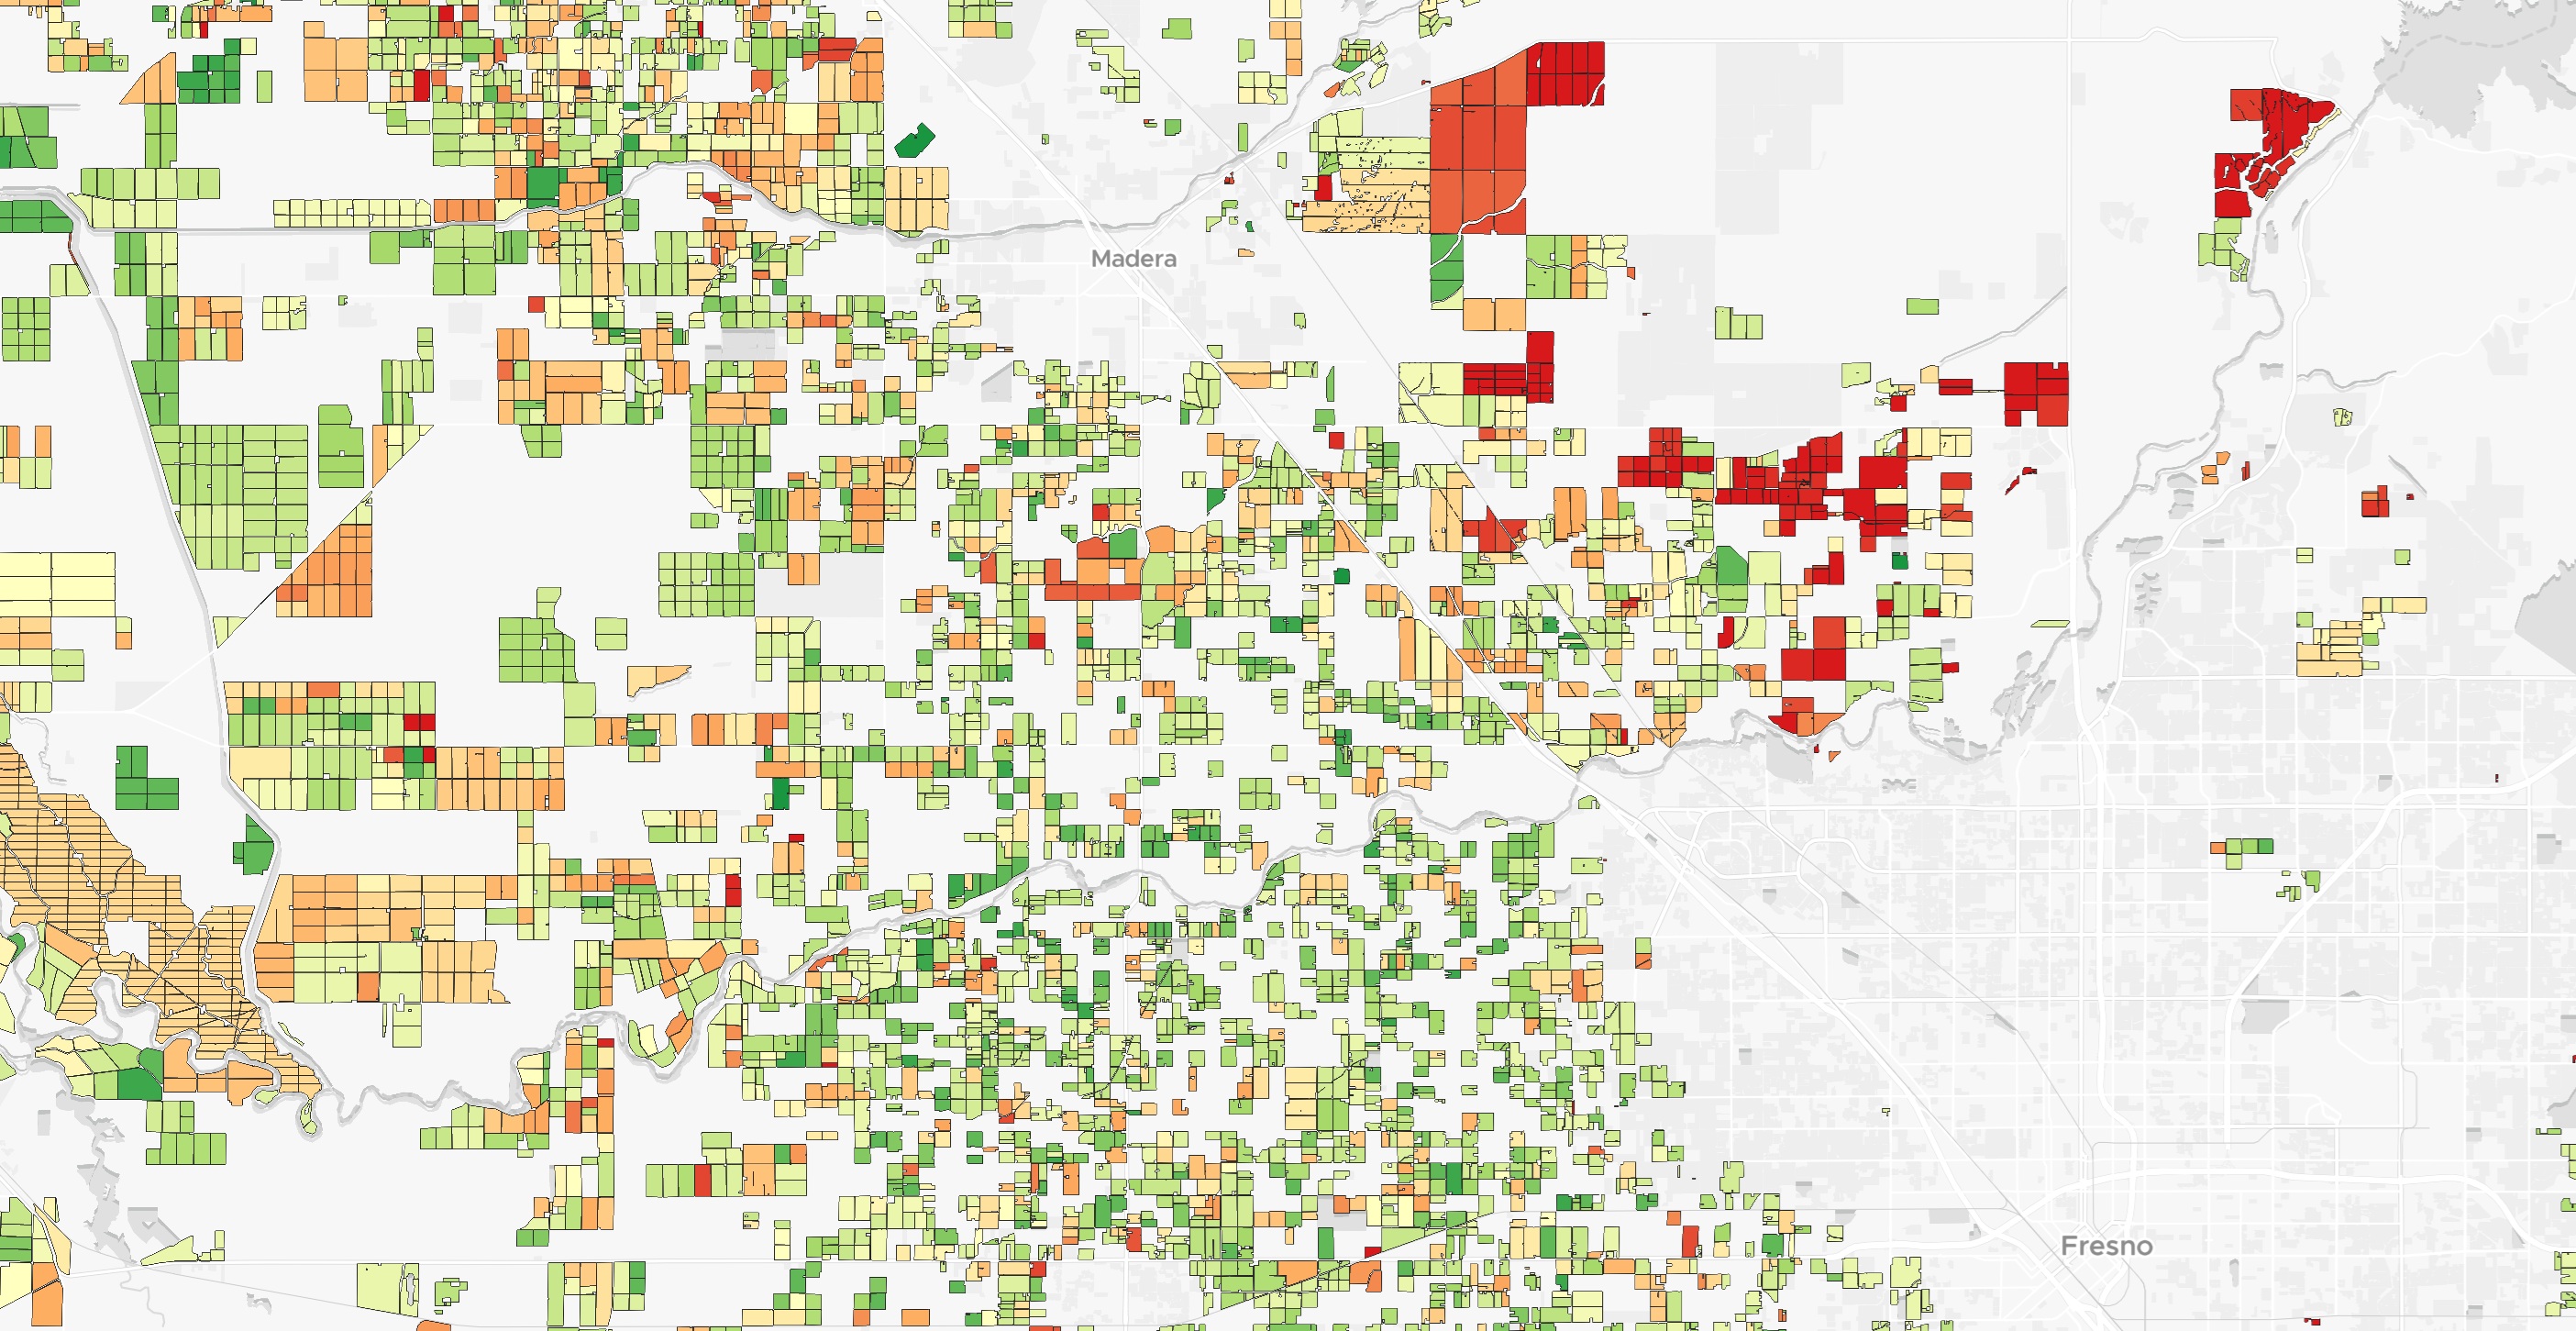
The DASI was modestly higher in the past fortnight as favourable conditions in the major almond-producing counties of Fresno, Kern and Madera offset slight declines in the Sacramento Valley growing regions.
Demeter Research TeamJun 08, 26